Tuesday 23 October 2012

Just got engaged!

  
Just got engaged to the beautiful Louise. At dinner a letter was brought out with dessert with the SEM image of the engraving on the ring and she said 'Yes'!

The engraving is 100 microns tall about the width of a human hair. It was machined with the femtosecond laser at the Photon Factory.

Something we weren't expecting was the small ripples formed by the laser inside the letters. This gave a grating which made it opalescent under the optical microscope. Sort of like the Paua shell. We use this in the lab to increase the efficiency of solar cells. We have currently only found a few metals that react to the laser in this way. So the white gold was unexpected.

Monday 22 October 2012

SEM in the lab

Paua shell overlaid onto SEM image.

The Photon Factory, my workplace, just got a new table-top scanning electron microscope (SEM), so I thought I would take some images of a Paua shell under the microscope.

 The Paua shell is New Zealand's national shell. However, few know why it has opalescent colouring. This is due to how the mollusc builds its shell using layers of microscopic calcium carbonate tiles stacked like bricks. (Here is a 3D structure of the argonite)
Paua shell we had in the lab
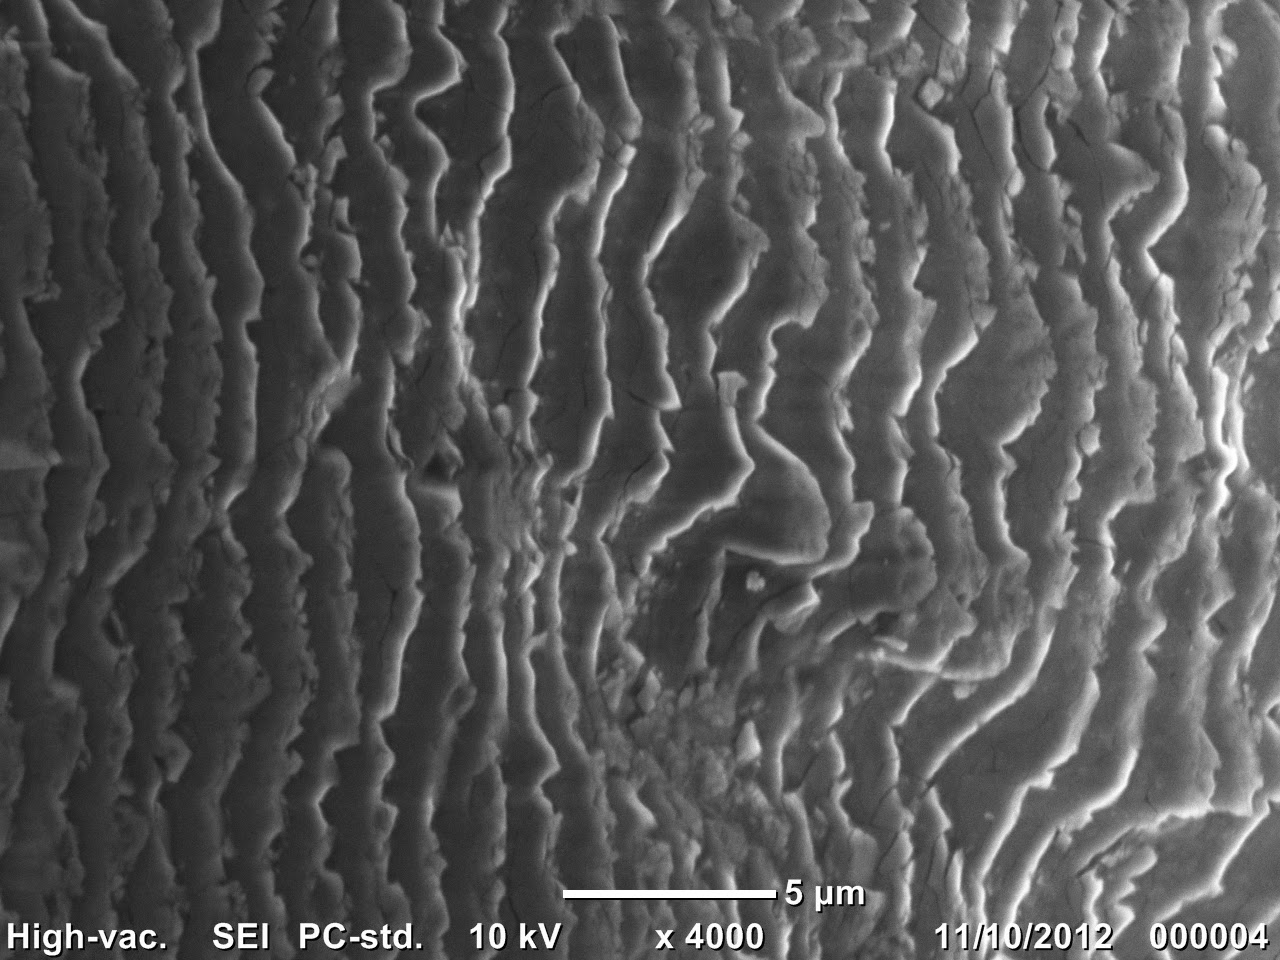
The new SEM is able to magnify up to 60,000 times with 15kV electron beam. It also has a low vacuum setting for biological samples. For its size, it does an amazing job of imaging right down to sub-micron objects.


This is what the Paua shell looks like on the top surface, showing the ridges of the calcium carbonate forming the grating.


What else would you like to see under the new SEM?Using GIMP I overlaid the picture with the the colours of the Paua shell.


Thursday 6 September 2012

Make Your Own Transient Absorption Data


Just put together a sage online simulator that lets you make your own spectrum with three different components.
  
Sage is a great package which allows for open-source mathematics with many different packages. It also comes with a nice notebook interface and has great interactive plotting capabilities with sliders and different inputs. It can also display Latex in the html.


I want to add in a singular value decomposition and show how the different components are extracted from the spectrum. It would also be good to get interface more responsive,