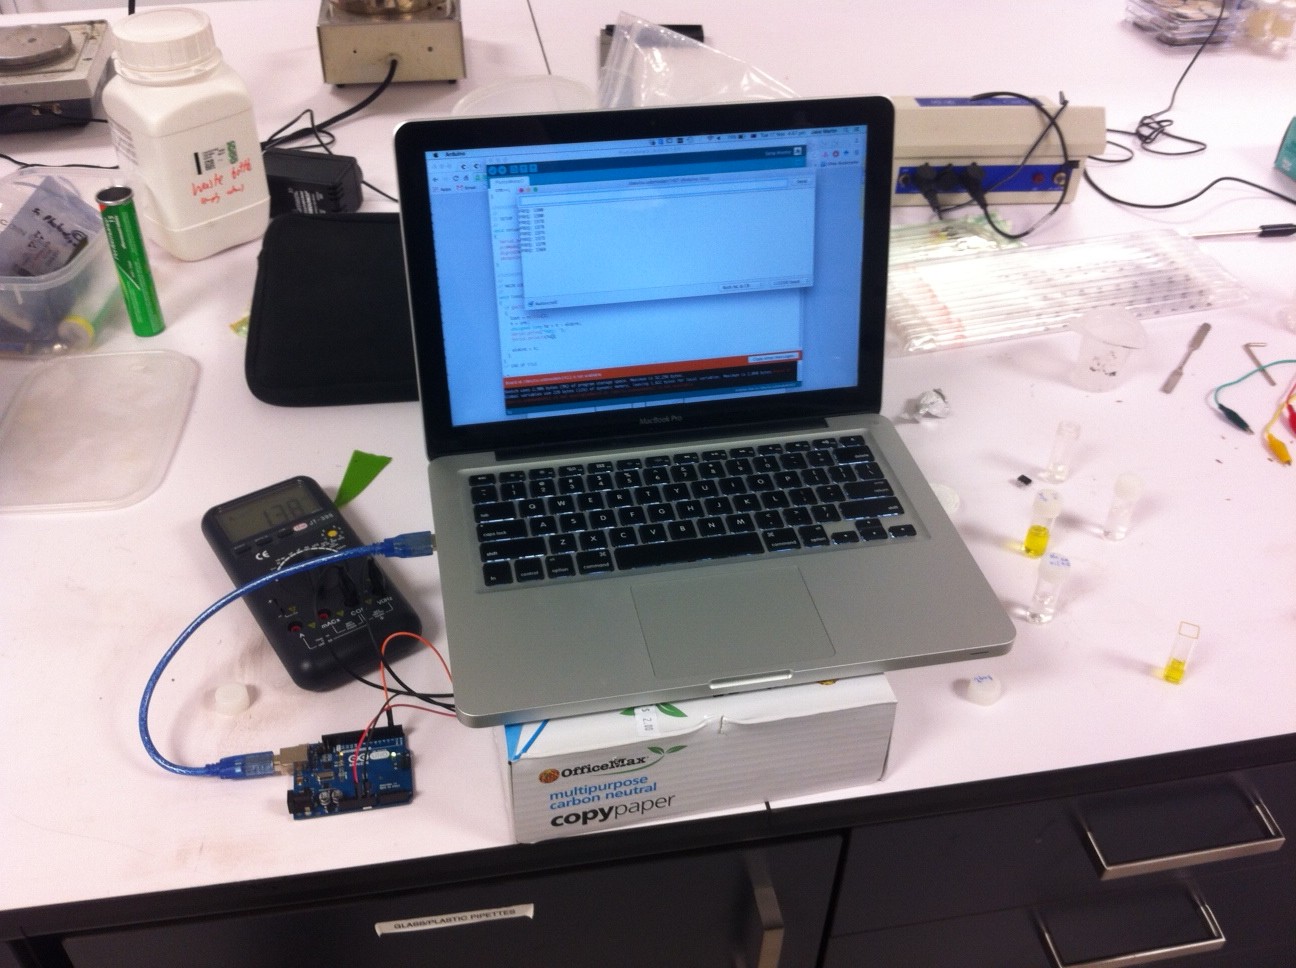
Showing posts with label colorimeter. Show all posts

Tuesday, 12 July 2016

DIY fluorometer for detecting oil pollution in water


The citizen scientist community, which in the United States has its roots in the gulf oil crisis, has been interested in measuring the amount of oil in water to track pollution like oil spills. One test kit that has been developed by the organisation Public Lab uses a laser and a webcam spectrometer to measure the fluorescence of different oils in order to identify the type of oil (https://publiclab.org/wiki/oil-testing-kit).
Link 
This is useful for identifying different types of oils but quantifying the amount of oil in a sample is also needed to track its spread and quantify the degree of pollution. However, detecting oil in water is difficult as the two separate. The standard method in the lab is to use a solvent (tetrachloroethylene ASTM D7066-4) to extract the oil from the water. Once extracted, either fluorescence (where the oil is illuminated with UV light and glows green/red) or infrared absorption of the C-H bond can be used to measure the amount of oil in the sample.


Figure 1 - Infrared transmission spectra of solvent without (left) and with (right) oil added. The band at 3000 cm-1 corresponds to vibrations in the C-H bonds which the solvent doesn't have and is used to quantify the amount of oil in the sample. (source: patent US4164653-2)

Figure 2 - Fluorescence spectrum from different oils excited with UV light (308 nm). (source)

The problem with these methods is that the equipment needed to perform the measurement costs a considerable amount, 500-1000 USD for a second-hand Fourier transform infrared spectrometer or a second-hand fluorometer on Ebay. I had done some work on making low-cost colourimeters using LEDs before and so I thought building my own fluorometer would be a good place to start.

I started by taking my multimeter colourimeter and measuring the voltage of a green LED, using it as a photodiode. There was a signal for highly fluorescent compounds such as vitamin B12, but it was very weak and would not be sensitive to small amounts of oil. One option was to construct an amplifier circuit, however this incurs a high assembly cost. I stumbled across this instructable on how to construct a very sensitive light sensor from a TSL237 light to frequency converter, which has a photodiode along with a built-in amplifier and voltage to frequency converter: (http://www.instructables.com/id/Highly-sensitive-Arduino-light-sensor/). This light sensor is very sensitive but what is more helpful is the conversion of the light intensity into frequency - a microcontroller like the Arduino is much better at measuring a frequency than a voltage. This means you can plug the sensor directly into an Arduino and take very accurate readings by converting the frequency to an illuminance value. The sensor only costs about 3.33 USD and is probably the most accurate sensor you can buy for that price.

After finding an accurate sensor, the other problem is the use of solvents. These are hard to source, require fume cupboards and are not safe for use at home. I found a solvent-free method online to extract oil from water, from the company Turner Designs, which makes fluorometers. The procedure consists of adding a solution to the oil and water mixture, heating it until it became cloudy and then cooling it down until it became clear and the oil is dispersed throughout. Certain detergents will drop out of solution when their temperature is raised. This only works for detergents that are not charged; heating an uncharged detergent interrupts the detergent-water interactions and causes them to no longer be soluble in water, the opposite of what you would expect. We had some Triton X-100 in the lab which is a non-ionic surfactant (detergent) with a cloud point of ~65 degrees C. Triton X-100 is safe to use and very cheap to buy. I prepared a 0.1% solution of Triton X-100 and added a small amount of olive oil, which has a good light emission at the wavelength where crude oil emits light. As such, this oil could be used as a standard for crude oil measurements.
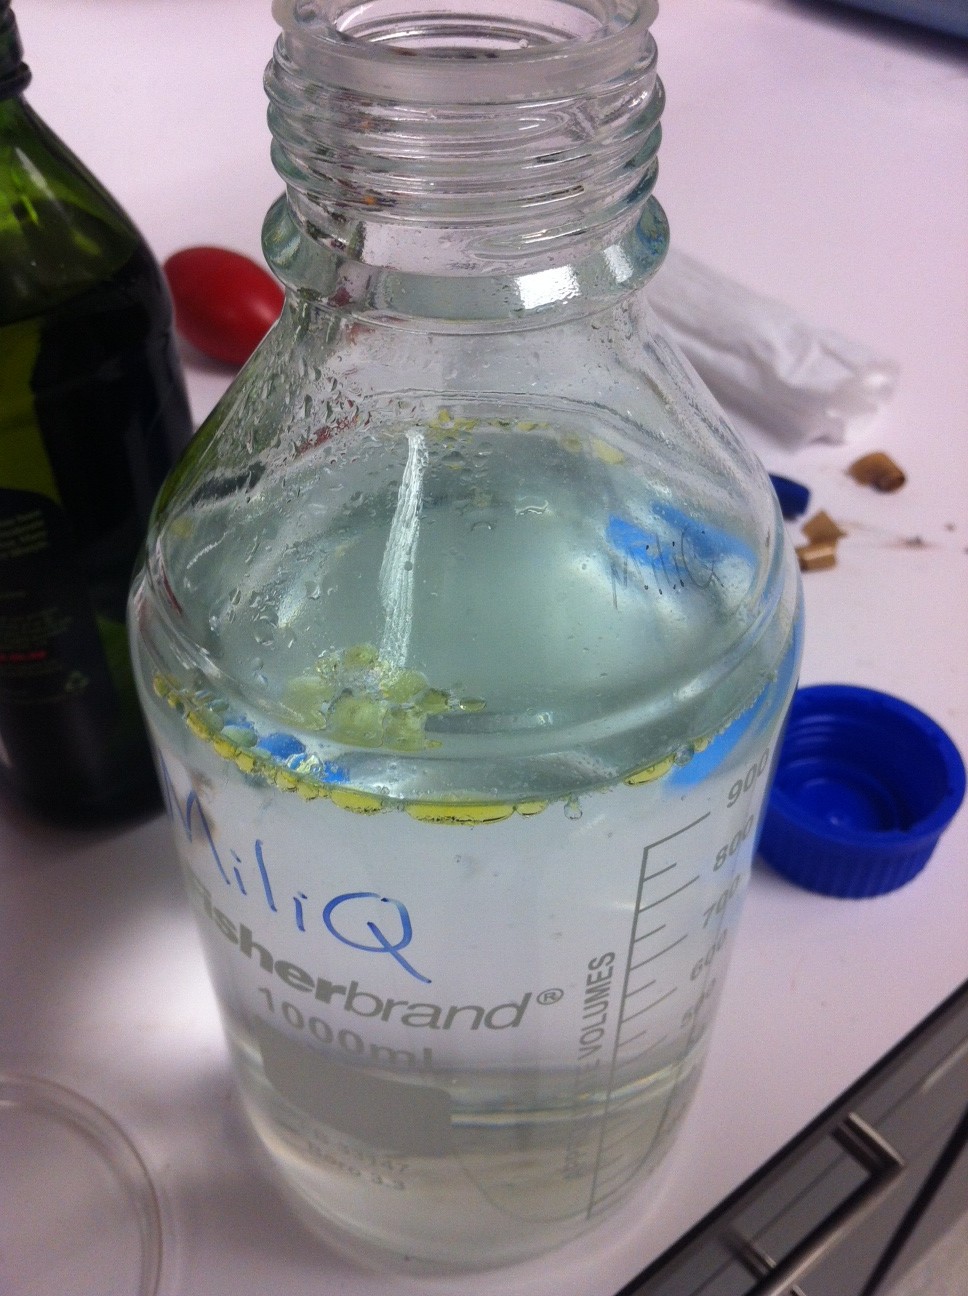
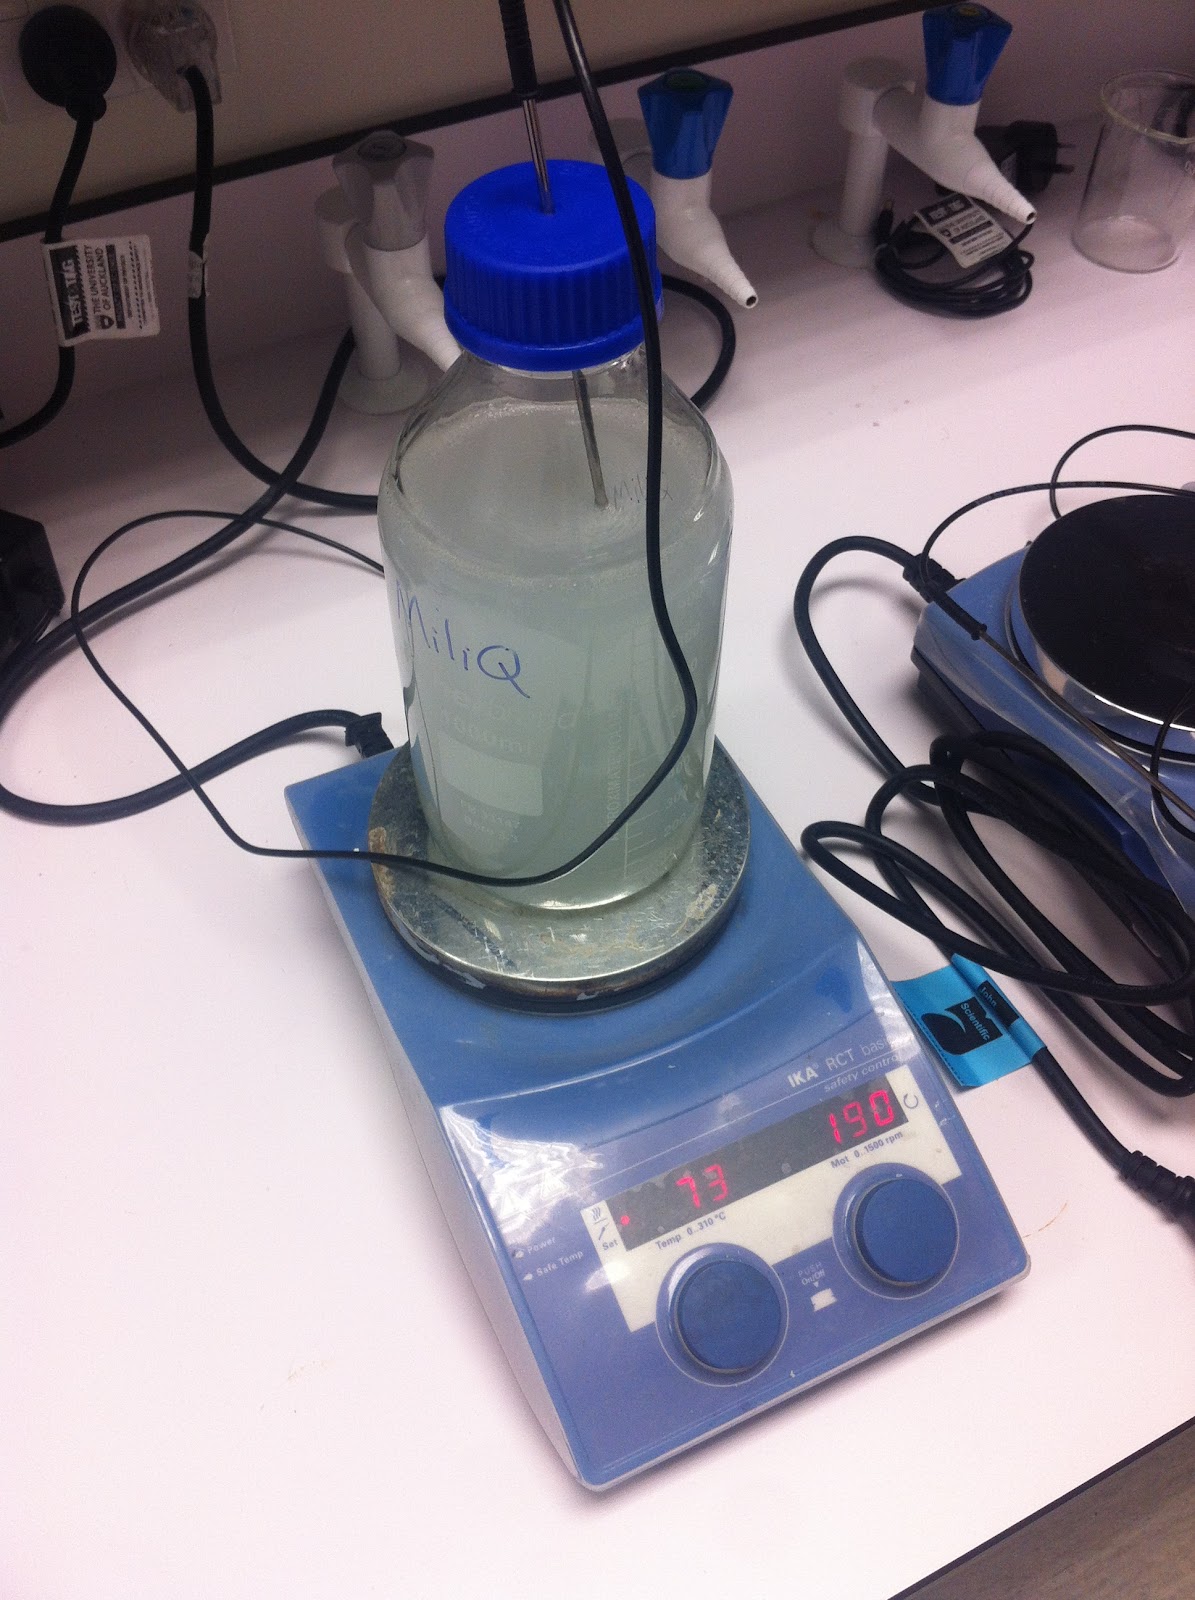
Figure 3 - Drops of olive oil floating on 0.1% Triton X-100 in water (left). Heating above the cloud point (70 degrees) (right) it becomes opaque; upon cooling it becomes completely clear.

I bought some TSL237 light-to-frequency converters from RS and used some Veraboard to solder one to some wires to attach to the Arduino. I also attached a 405 nm LED with a resistor (220 Ohms) between 0 and 5V of the Arduino. I used four layers of green cellophane which allow through ~500 nm, the peak of the emission, and block out the UV light from the LED. I found that four layers were necessary to block the UV LED to the point where it was not picked up and without any sample added the reading was the same whether the LED was on or off.
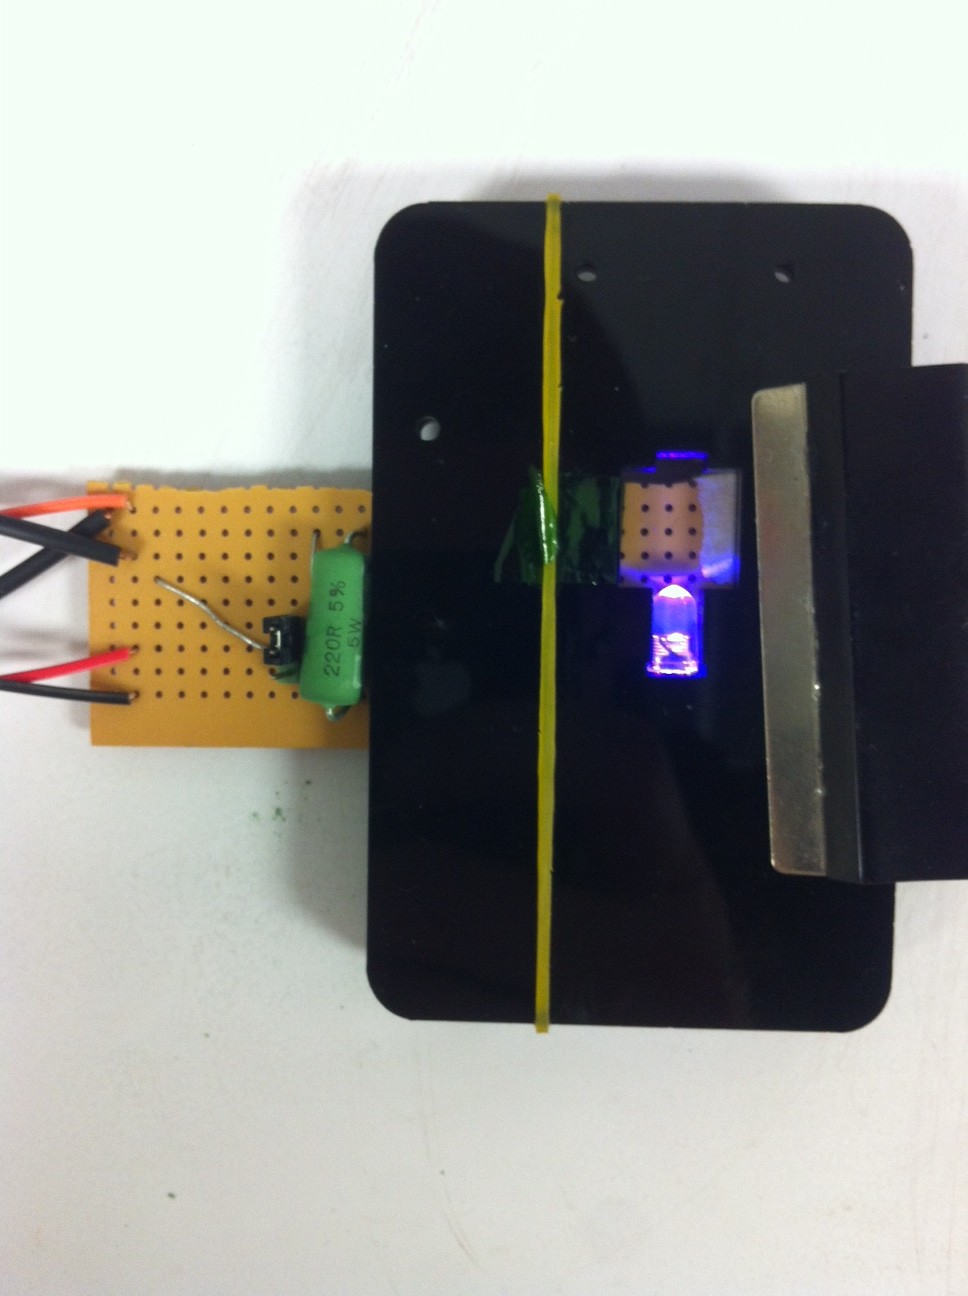
Figure 4 - Veraboard circuit which connected the light sensor and LED to wires, which plugged into the Arduino. It is attached to a laser cut colourimeter, and to my laptop.

I made use of the great Freqperiod library to measure the frequency, a software library for Arduino that is designed to measure frequencies below 20 kHz. It measures frequency in Hertz to six decimal places. There are other libraries to measure above 20kHz that means that by changing the software you can measure a huge dynamic range of light intensities. (http://interface.khm.de/index.php/lab/interfaces-advanced/frequency-measurement-library/) Most of the readings were in the hundreds of Hz. Full room lights were 20kHz while the maximum reading the sensor can do is 1000kHz (see Figure 5).
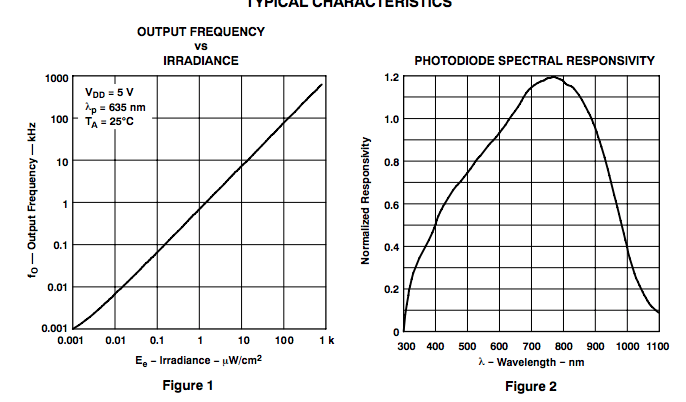
Figure 5 - Frequency vs. light irradiance (left) and response curve (right) taken from the datasheet for the TSL237 light-to-frequency converter. 

Below are the readings for different samples. The filter attenuated a lot of the light. The next improvement is to buy a better filter. In fluorescence measurements large lenses are often used to collect as much light as possible. So integrating a lens could also help, however all of these additions increase the cost of the unit. 

SampleFrequency (Hz)
Water42.9±0.2
Triton X-10045.0±0.2
100 ppm olive oil55.1±0.2
1000 ppm olive oil62.3±0.2
Pure olive oil5985
Room lights20,000


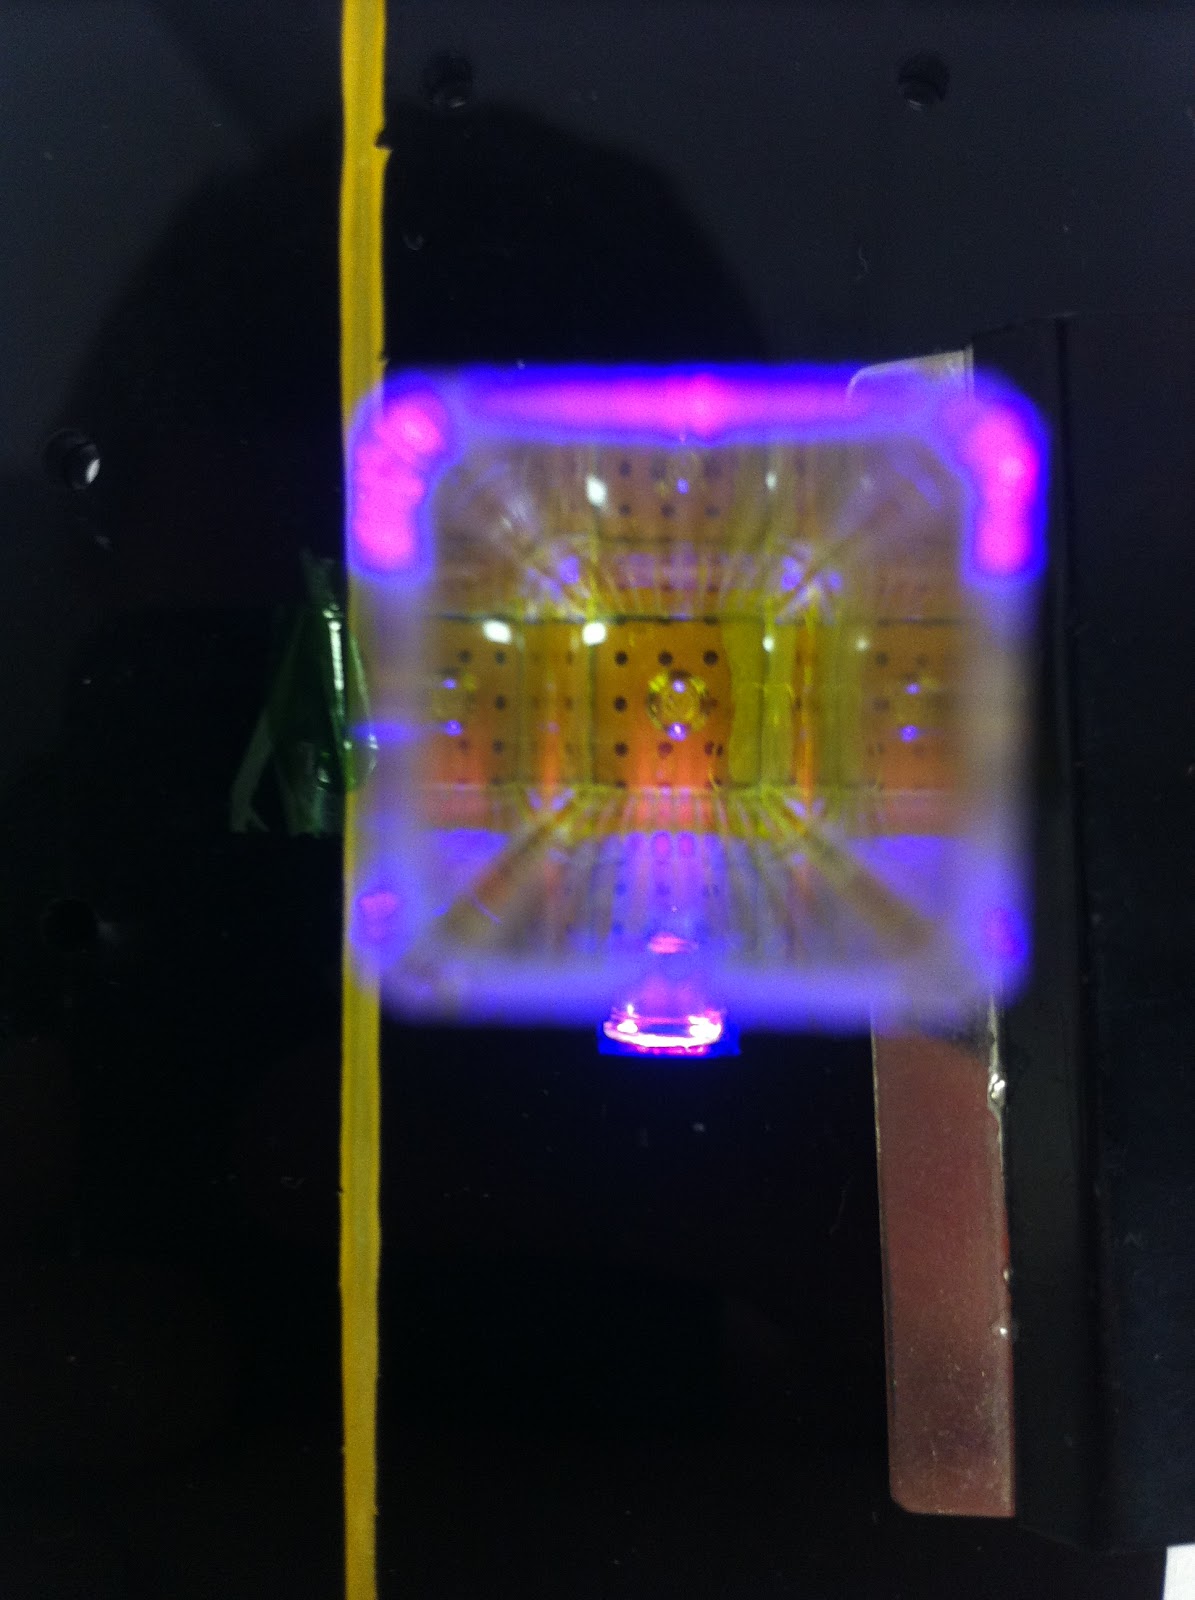
Figure 5 - Olive oil excited with 405 nm LED emitting red light. The decay of the red emission into the olive oil indicates it is saturating and absorbing all of the light before it can reach the other side of the cuvette. This leads to incorrect readings; for an accurate reading the olive oil would need to be diluted. 

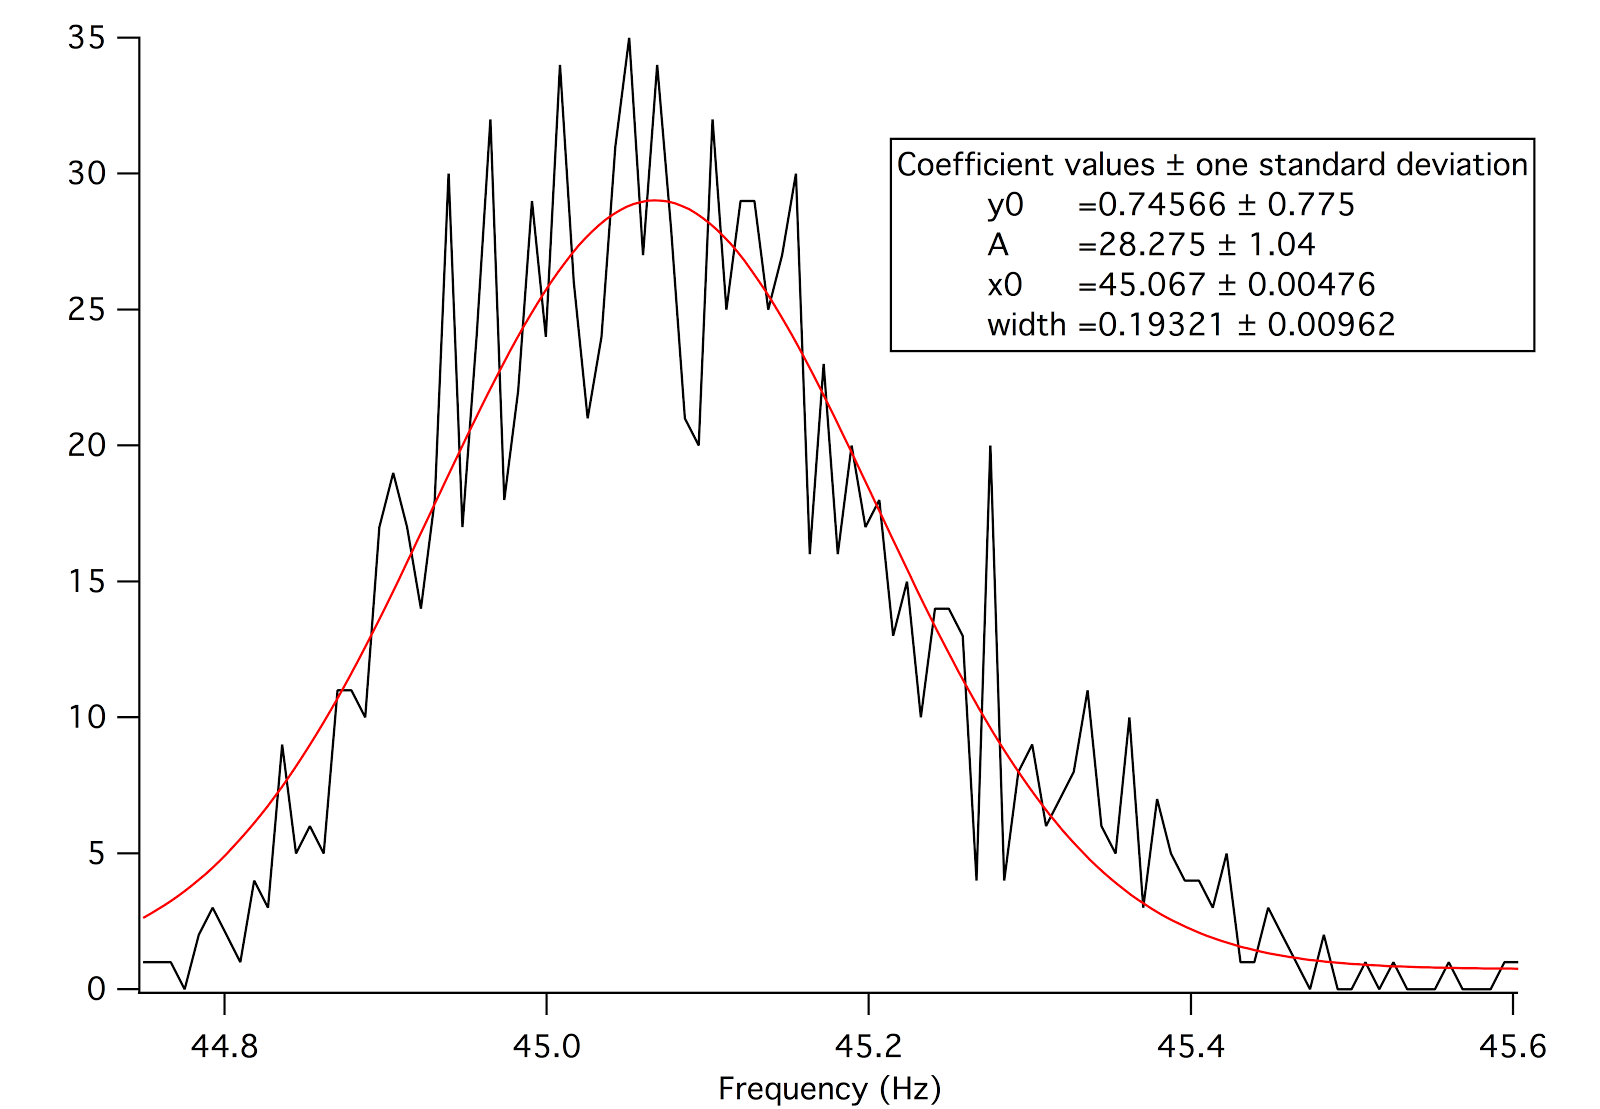
Measuring the stability of the reading over time gives a fairly narrow band of frequencies with a deviation of only ~0.2 Hz. The readings are stable enough to compare samples ranging from 100 - 1000 ppm. With a better filter, there is potential to detect samples of under 100 ppm. 
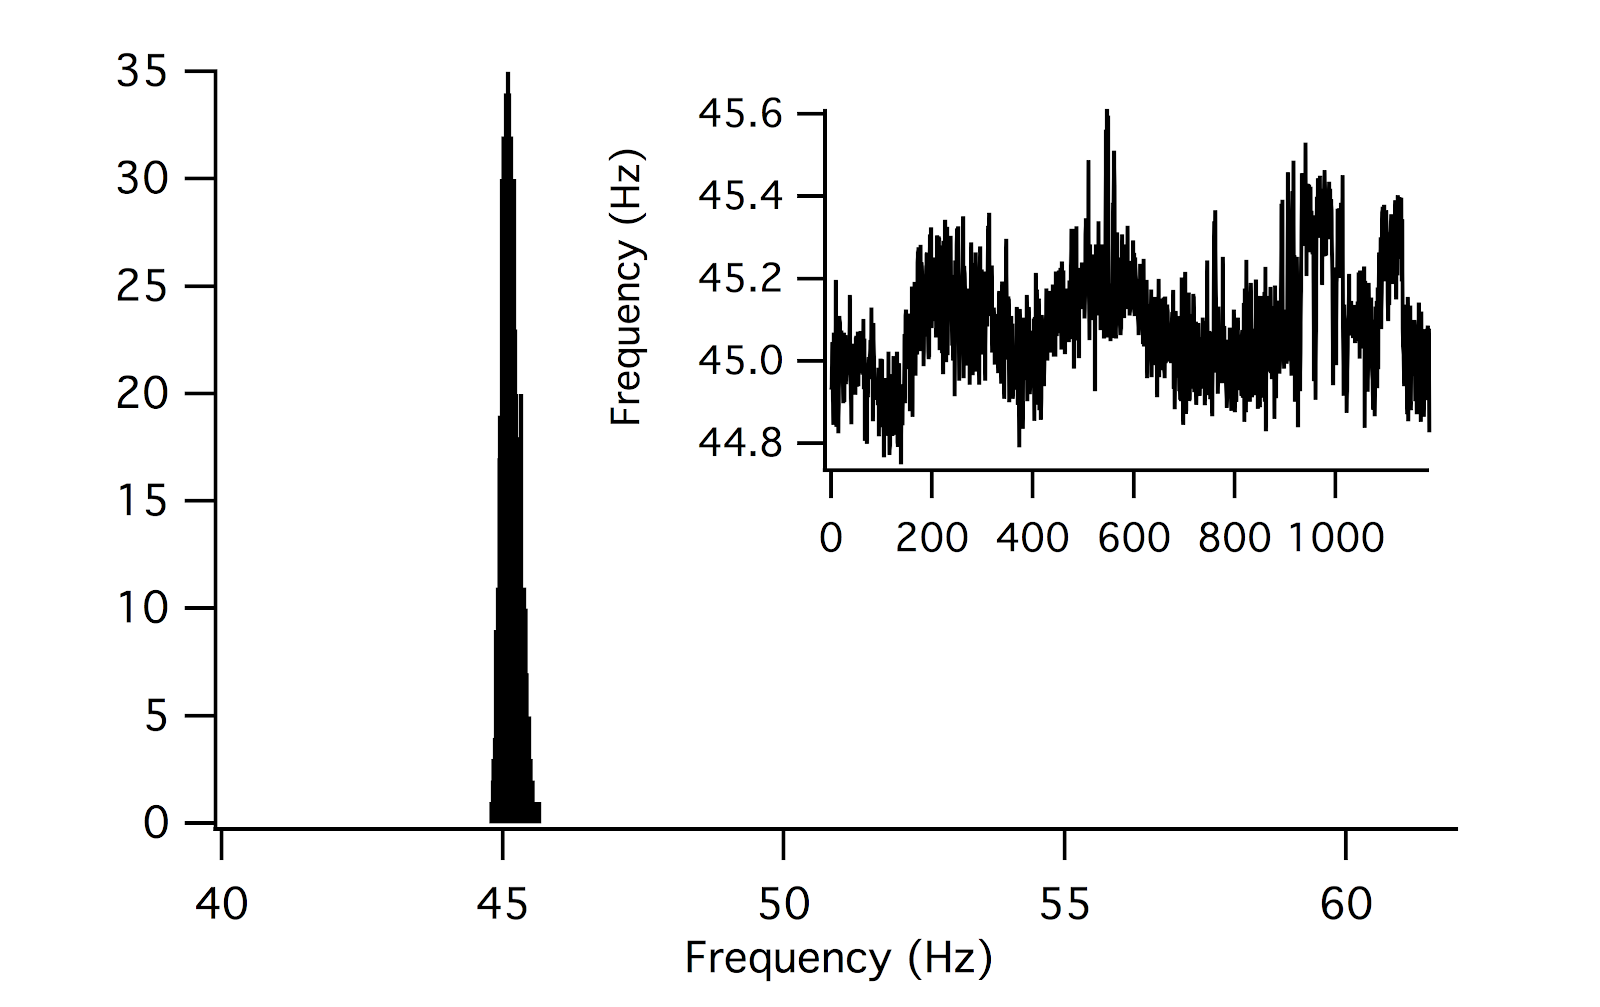
Figure 6 - Measurement over a few minutes (inset top) with the histogram of frequency readings (top) and fitting to a normal distribution (perhaps log-normal would've been better) giving a width of 0.2 Hz.

The next step is to integrate it into an Arduino shield. The cost of something like this would come down to the price of the Arduino but because you only really need one pin to measure the frequency you could use something like the Adafruit trinket (6.95 USD) and make the whole thing for under $20. Any interest in helping to do this would be greatly appreciated as I have left all of my soldering supplies in New Zealand (I now live in Cambridge, UK). 

Figure 7 - Diagram of a shield for an Arduino Micro, with an added RGB LED for optical absorption measurements on the same device. In order to take a reading, a box would be needed to put over the device, or a 3D printed holder for the cuvette could be designed.

Another interesting application is in water testing. Turbidity is an important measure of water health and my biology friends tell me it is very important as fish can't see their prey if the water is cloudy. This accurate light sensor could be used to measure turbidity. A student and I have also been working on using milk as a standard for preparing turbidity standards to calibrate the measurement. Anyway, there is more to come on this. If anyone is interested in helping out or if you have any questions, please let me know in the comments. 

Sunday, 30 November 2014

Low-cost Laser Cut Colorimeter


There are many low cost spectrometers on the internet that make use of compact discs and low cost CCD detectors from cell phones or webcams to determine the different colours that are emitted or absorbed by objects. These spectrometers are great for many applications where you want to look at the relative intensity of the different colours such as what colours are absorbed by a molecule or looking at whether the light is spread out or whether only specific colours are emitted as is the case with LEDs and fluorescent lights. These spectrometers have one large flaw - auto-exposure. Autoexposure means that the time that the CCD takes to collect light from the sensor is dynamically adjusted. Some expensive cameras allow this to be adjusted however most cell phones and web cams do not. This means that comparisons between different spectra intensities are difficult and getting reliable measurements of intensity out of these instruments is near impossible.


This is where the colorimeter comes in. By using only a single coloured LED and a light dependent resistor a low cost reliable measurement can be made of how a substance absorbs light. There are a large number of colour based test kits for nitrates, phosphates, pH and nitrites that could use this colorimeter for environmental monitoring. Other applications include measuring yeast growth rates through a turbidity measurement and if an LED is used as the detector a fluorescence measurement could be done which may be of interest in the environmental monitoring of oil in the environment.

You can buy educational colorimeters for 147 USD (http://www.vernier.com/products/sensors/col-bta/) 144USD (http://smartschoolsystems.com/Colorimeter/56), a nice open source model is made by IORodeo for $85USD and commerical systems are even more expensive.


Instead of a complete computer control system the whole idea of this project was to strip the colorimeter down to the least number of components at the lowest cost possible to get it out to schools, citizen scientists and researchers. There have been many colorimeters build recently that make use of 3D printed parts but due to the time needed to print we opted for laser cutting which is cheap and quick to fabricate. To avoid the need for a box which would involve more materials and assembly, a layering of laser cut sheets was used. Borrowing from the royal society colorimeter we make use of a multimeter which can read the resistance of a light dependent resistor the CdSe or CdS LDRs are cheap and can detect similar colours to our eyes (however they are not very good in the IR). This is the cheapest option low cost multimeters are ~$5 and many schools already have multimeters. Using a button battery (CR2032) allows the device to be portable and also current limits the LED so there is no need for a resistor in series with the LED. However as the battery's energy is used the system will need to be recalibrated as the voltage will drop. Most CR2032 button battery have around 225mAh, an LED drawing ~16-18mA should allow at worst 12 hours of operation.


The three layers made of 3.5mm acrylic was laser cut using a 30W CO2 laser. The top layer is the shielding layer which holds the battery in place, the middle layer contains the light dependent resistor on the left and the LED on the right. Any 5mm LED will work, the LED is connected to a button battery and the final layer clamps the other side of the LED legs onto the battery.

The pins for the multimeter plug into the holes where the LDR pins have been pulled through this forms a good tight connection meaning no soldering needed. A clip is used to stabilise it and keep the legs of the LED connected to the battery.

The cost of the different components not including the multimeter came to under $2NZD. I will do one more check on the laser cut designs and upload them to thingiverse for anyone to use in the next few days.

Nitrate colorimetric test

Excess nitrates in waterways leads to algal blooms and can kill wildlife. Monitoring streams and waterways is therefore an important target. To begin with a 3D printed spectrometer based on the publiclab.org design was used to look at what colours are absorbed by the API nitrate test kit dye (a ~$10USD test kit that can do a 100 tests).


3D printed spectrometer with the iphone LED flashlight as the light source. Another cell phone was used to collect the spectra.

From left to right; the LED from the iphone contains blue, green and red light, the dye without any nitrate added shows an absorbance in the blue, the solution appears yellow so this makes sense, the dye with the dye and nitrate show the absorption of the green light. The line plots were done in ImageJ using the profile plot.

Standards were then prepared of zinc nitrate in a range which is common in fresh water 50ppm, 100ppm 150ppm and 200ppm. 


The API test kit contains two solutions that need to be added and then a colour develops over time. The colour becomes more red as the green is absorbed by the dye-nitrate complex.

Colour card that came with the API nitrate test kit showing the range of colours.

Human error in reading the card makes the test not very accurate and the difference between what different people deem to be a particular colour varies. By measuring using a colorimeter you can measure much smaller changes in nitrates and remove the variability introduced through the colour card.


Colorimeter with the blue LED we later used a green LED as well.

A test tube covered with tape was used to block the ambient light from the room. You could also use a toilet roll or a film canister.

Taking the logarithm of the resistance (which is a measure of the absorbance) should give a value proportional to concentration. Using the blue LED (wavelength of 495nm) we get a linear relationship between the nitrate concentration and log(R).

Next we tried a green LED as we saw that green was being removed when the nitrate was being added. The sensor showed a non-linear response with absorbance but a linear response in intensity.

The bottom plot shows the nitrate concentration vs. the resistance which is linear this indicates the non-linearity is logarithmic and most likely due to the sensor. To work out if the non-linearity was the sensor not responding linearly or the test we used a spectrometer that we could control the exposure time and get a good reading of the absorbance.


Absorbance vs. wavelength for the different solutions you can see that as nitrate is added the dye starts absorbing in the green part of the spectrum.

Plotting the peak absorbance at 550nm as it changes with the nitrate concentration a linear relationship is found and therefore test is linear and the sensor is non-linear for the intensities it was dealing with.It could also be the multimeter which may not have the best electronics (highest impedance opamp).


This is OK as you can fit a polynomial or even better a logarithmic fucntion (as the error is probably logarithmic) and use that to determine the nitrate concentration from an unknown by plugging the absorbance into the equation.

The next step is to see if quantitative fluorescent measurements could be done by using another LED as a detector (http://www.instructables.com/id/LEDs-as-light-sensors/). This could allow for measurement of the oil in water for example. If you choose an LED with a green or red emission they have build in filters so a combination of a blue (405nm) LED and a green LED as a detector could be used to determine quantitatively the amount of oil in water. It looks like devices already exist that use LEDs to do this measurement. This may interest the publiclab community as the characterisation of the type of oil could be done with a low cost spectrometer and the concentration measured using the colorimeter. (http://publiclab.org/wiki/oil-testing-kit)

This work was done as part of preparation for the year of light 2014 with Sandra Jackson the teacher fellow currently in the Photon Factory.

Sandy preparing the standard solutions of Zinc nitrate.

Here are some links to interesting pages on colorimeters that the Photon Factory colorimeter borrowed from.

Breadboard with LED powered by 9V battery and LDR connected to a multimeter.
http://www.sciencebuddies.org/science-fair-projects/project_ideas/Chem_p075.shtml#procedure

First design that caught my attention with a LED and LDR on a pcb.
http://www.rsc.org/education/eic/issues/2007Sept/BuildYourOwnSpectrophotometer.asp

Nitrate and phosphate detection using LED and LDR that included tuning of the LDR circuit.
http://www.home.zonnet.nl/rsetteur/aquarium/karel/colorie/coloriemeter_eng.htm

IORodeo low cost colorimeter with great posts on doing nitrate measurements and integration with an Arduino and software.
http://www.iorodeo.com/blog/colorimeter

Good open source review of using LEDs as sensors for fluorescence and for absorbance measurements
http://www.mdpi.com/1424-8220/8/4/2453/htm

Article using LEDs as detectors (for fluorescence)
http://www.sciencedirect.com/science/article/pii/S0003267003005750

Laser cut LDR LED box with a multimeter as the measuring device
http://www.thingiverse.com/thing:479533

Michigan tech colorimeter using an Arduino and a 3D printed case.
http://www.appropedia.org/Open-source_colorimeter
http://www.thingiverse.com/thing:45443


This was all integrated into an opensource colorimeter for water quality measurements.
(Article on water quality (unfortunately not open source) http://www.iwaponline.com/washdev/004/washdev0040532.htm)
OS water platform.JPG